Dashboards
The "Analysis" menu gives access to the following dashboards:
-
Steering: overall follow-up of live measurements, ownership and lateness
-
by domains: status of the measurements by domain
-
by controls: history of the measurements of a control
-
by measures: status of the controls of each domain
-
by attributes: status of the measurements by attribute
-
by action plans: status of the action plans
Steering
This screen is available to administrators, users and auditors. It gives a management view of the measurements: how many are live, how many are late, who owns them and what should be done first.
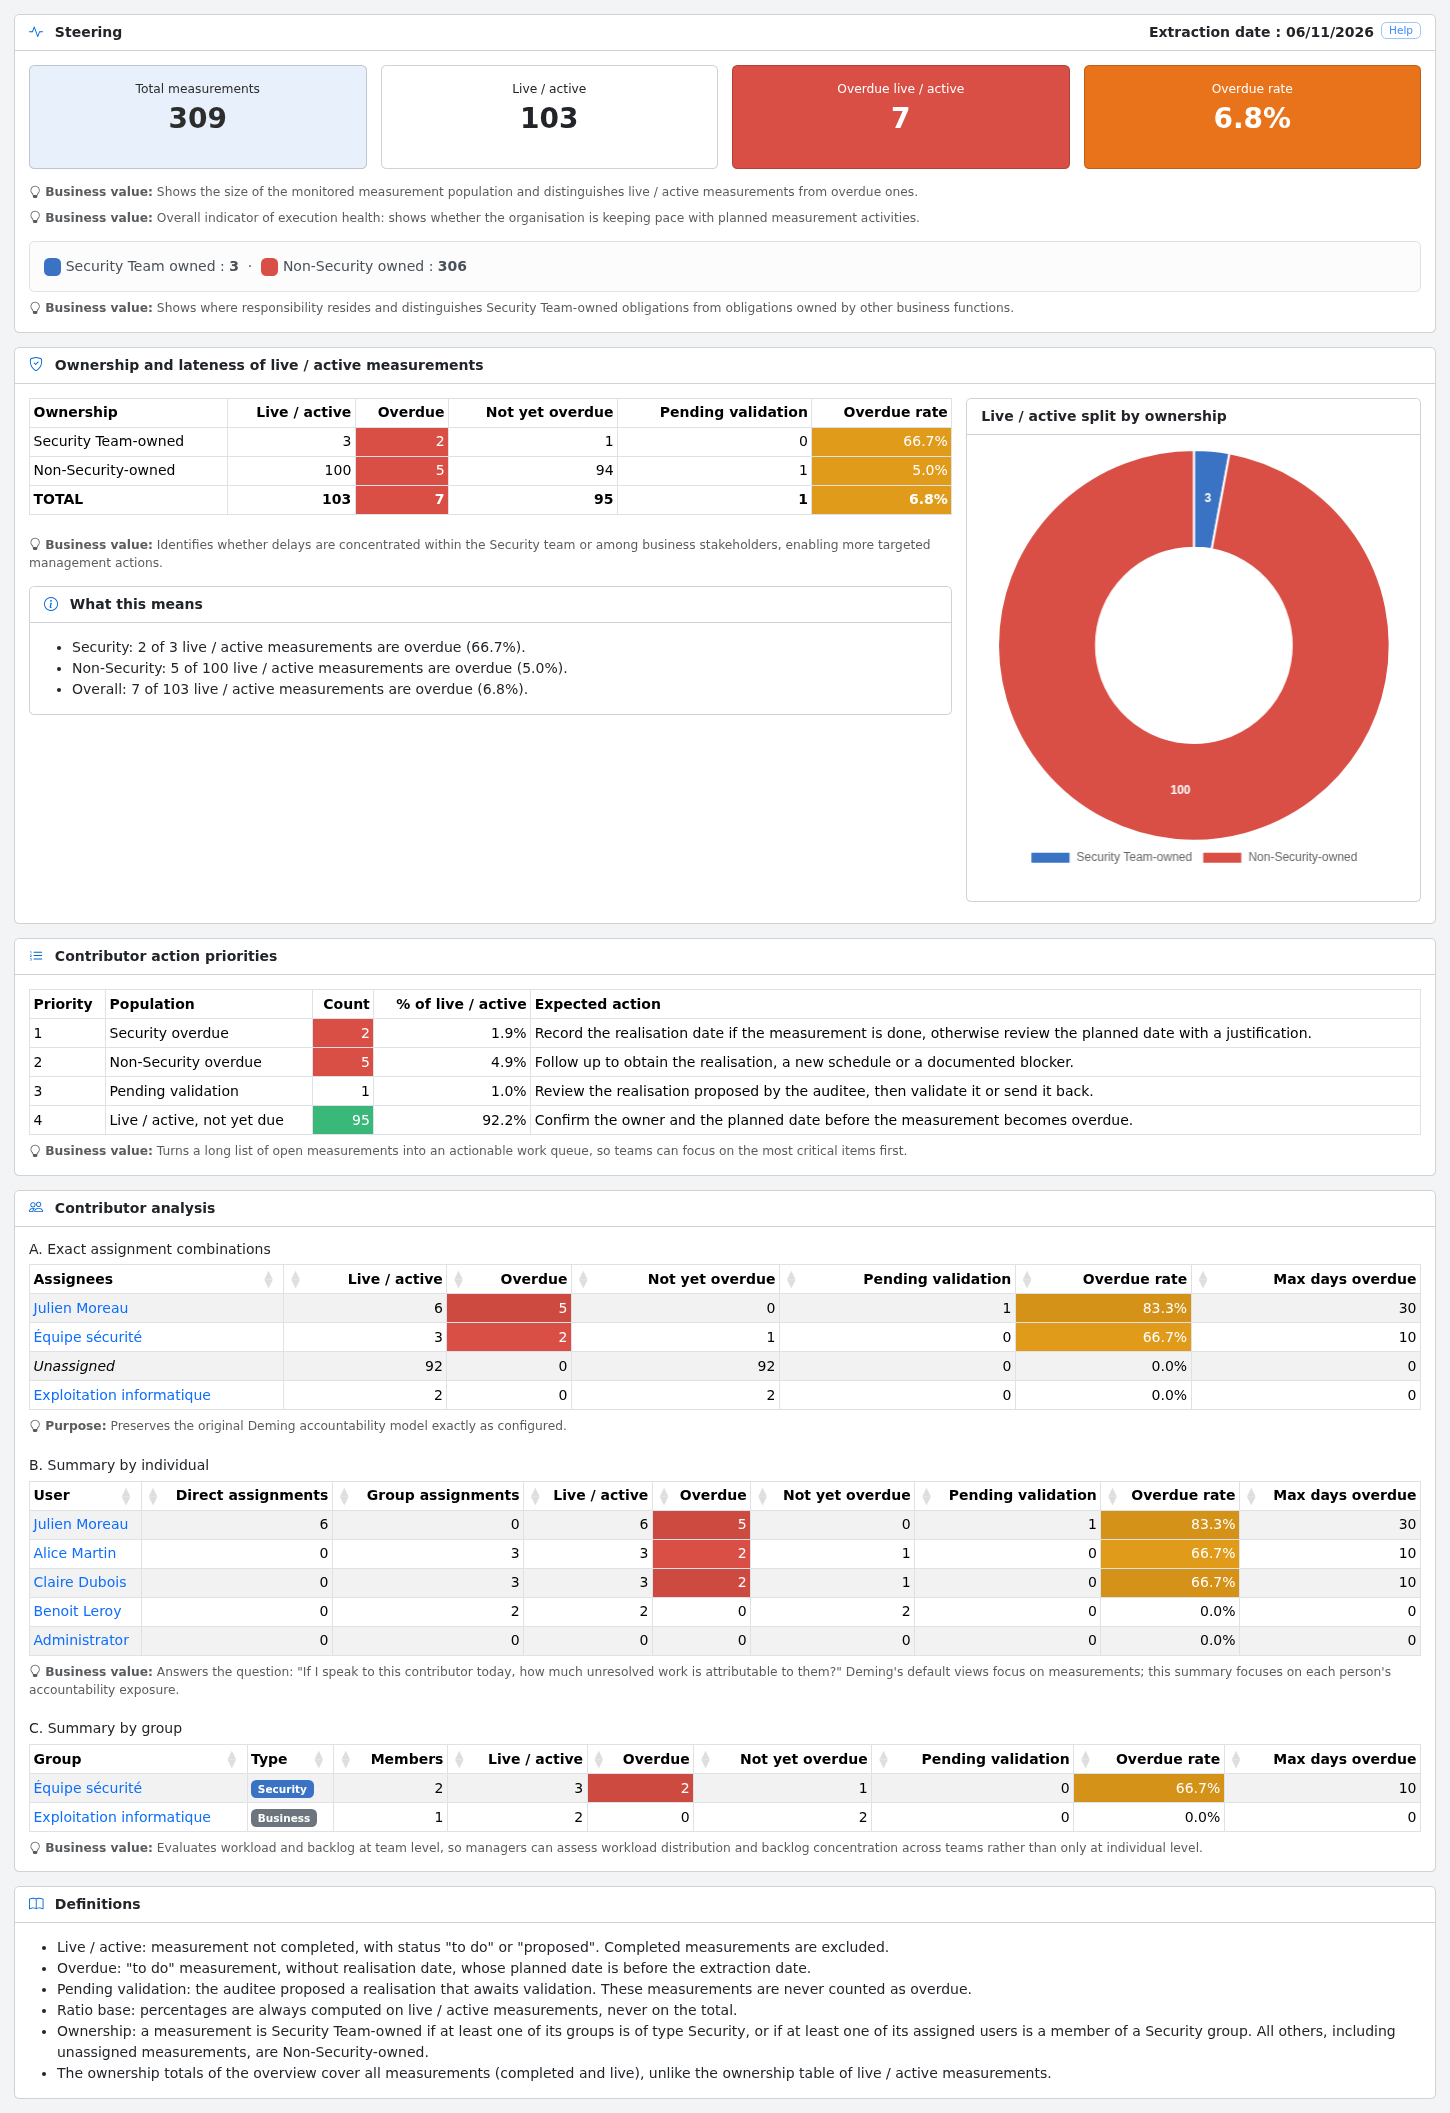
The screen contains:
-
Overview: total number of measurements, number of live / active measurements, number of overdue live measurements and overdue rate. The number of measurements owned by the Security team and by the other business functions is also displayed.
-
Ownership and lateness of live / active measurements: for Security Team-owned and Non-Security-owned measurements, the number of live, overdue, not yet overdue and pending validation measurements, the overdue rate, a chart of the split by ownership and a plain-language summary ("What this means").
-
Contributor action priorities: a work queue ordered by priority (Security overdue, Non-Security overdue, pending validation, not yet due) with the expected action for each population.
-
Contributor analysis:
- A. the exact assignment combinations (users and groups) as configured in Deming,
- B. a summary by individual, counting direct assignments and assignments through a group,
- C. a summary by group, with its type (Business or Security) and its number of members.
Each user and group name links to its page. Administrators get every link; other users only get the link to their own page.
- Definitions of the indicators used on the screen.
The ownership of a measurement is derived from the group type: a measurement is Security Team-owned if at least one of its groups is of type Security, or if at least one of its assigned users is a member of a Security group. All other measurements, including unassigned ones, are Non-Security-owned.
All figures take into account the "my data / all data" switch of the toolbar.
By domains
This screen displays, for each domain, the number of measurements by result (green, orange, red). It can be filtered by framework and scope, and grouped by control or by measurement.

By controls
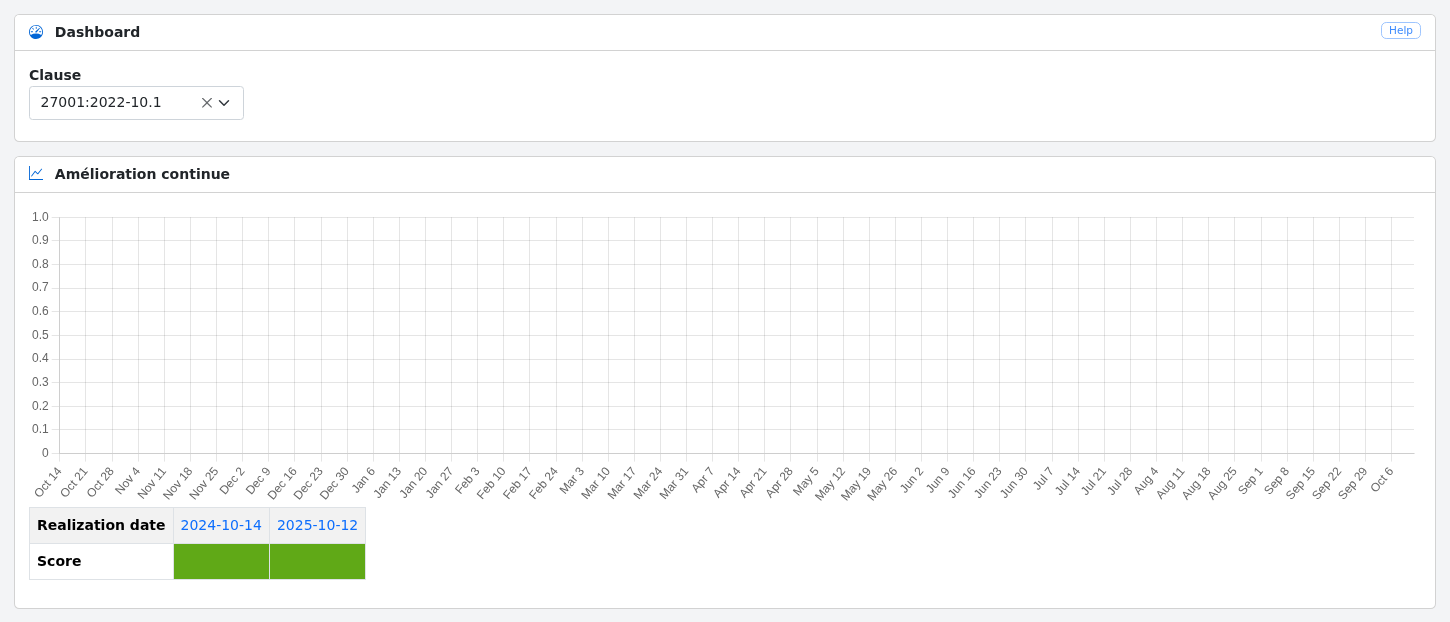
This screen displays the history of the measurements of a control selected by its clause.
By measures
This screen displays, for each domain, a radar of the last score of each control together with the list of controls, their last realization date and their next planned date. It can be filtered by scope.

By attributes
This screen displays the measurement results grouped by attribute.

By action plans
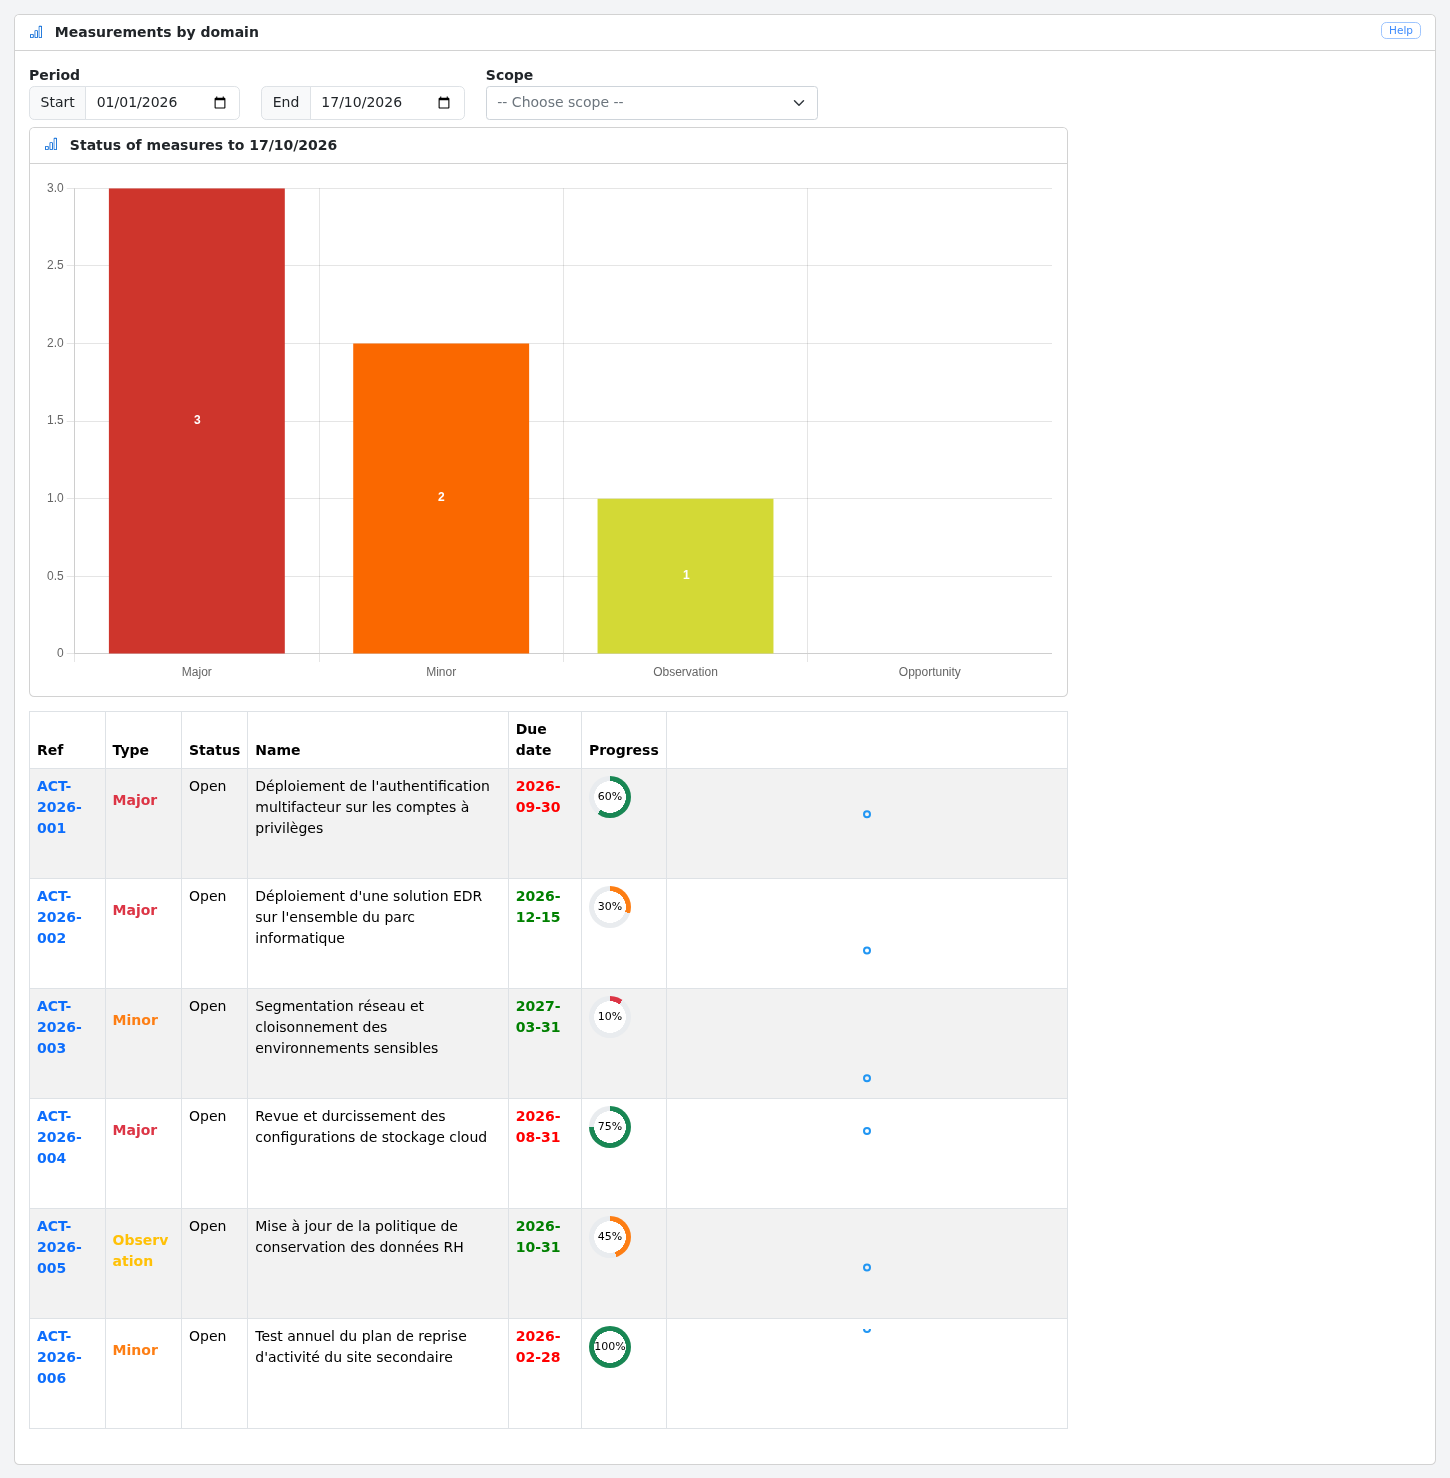
This screen displays the number of action plans by type (major, minor, observation, opportunity) over a period, with the list of action plans and their progress. It can be filtered by scope.